Plot method for NSGEV objects.
Arguments
- x
A NSGEV object
- y
Not used.
- which
An integer. The value
1will lead to a plot with the observation number used for the \(x\) axis. With the value2the \(x\) axis is the covariate, assuming that there is only one covariate.- pLim
A numeric vector with two probabilities used to set the
ylimparameter ofplot.default. The model quantiles for these probabilites are computed and added to the range used to chooseylim.- showQuant
Not used yet.
- ...
Other arguments to be passed to methods.
Value
Nothing.
Examples
example(NSGEV)
#>
#> NSGEV> df <- data.frame(t = 1:10)
#>
#> NSGEV> ## built a model with given coefficients
#> NSGEV> psi <- c("alpha" = 1, "beta" = 0.01, "delta" = 0.6, "xi" = 0.06)
#>
#> NSGEV> ns0 <- NSGEV(formulas = list("loc" = ~ alpha + beta * t, "scale" = ~ delta, "shape" = ~ xi),
#> NSGEV+ data = df, psi = psi)
#>
#> NSGEV> ## simulate a path
#> NSGEV> set.seed(1234)
#>
#> NSGEV> ysim <- simulate(ns0, nsim = 1, psi = psi)
#>
#> NSGEV> df2 <- cbind(df, y = ysim[ , 1L])
#>
#> NSGEV> ns1 <- NSGEV(formulas = list("loc" = ~ alpha + beta * t, "scale" = ~ delta, "shape" = ~ xi),
#> NSGEV+ data = df2, response = "y", psi = psi, est = "optim")
#>
#> NSGEV> ## try an exponential link
#> NSGEV> ns2 <- NSGEV(formulas = list("loc" = ~ exp(alpha + beta * t), "scale" = ~ delta, "shape" = ~ xi),
#> NSGEV+ data = df2, response = "y", psi = psi, est = "optim")
#>
#> NSGEV> ## compare the estimation with that of ismev::gev.fit
#> NSGEV> require(ismev)
#>
#> NSGEV> ns1.ismev <- gev.fit(xdat = df2$y, ydat = as.matrix(df), mul = 1, show = FALSE)
#>
#> NSGEV> rbind("NSGEV" = c(ns1$estimate, "negLogL" = ns1$negLogL),
#> NSGEV+ "ismev" = c(ns1.ismev$mle, "negLogL" = ns1.ismev$nllh))
#> alpha beta delta xi negLogL
#> NSGEV 1.143777 -0.002918431 0.6033124 -0.4359059 8.22994
#> ismev 1.143704 -0.002906355 0.6032869 -0.4358915 8.22994
#>
#> NSGEV> ## Try an expoential link
#> NSGEV> ns2.ismev <- gev.fit(xdat = df2$y, ydat = as.matrix(df), mul = 1, mulink = exp, show = FALSE)
#>
#> NSGEV> rbind("NSGEV" = c(ns2$estimate, "negLogL" = ns2$negLogL),
#> NSGEV+ "ismev" = c(ns2.ismev$mle, "negLogL" = ns2.ismev$nllh))
#> alpha beta delta xi negLogL
#> NSGEV 0.3976449 -0.11871098 1.5582157 -1.0861830 8.106294
#> ismev 0.1284920 -0.00155176 0.6035595 -0.4351343 8.230150
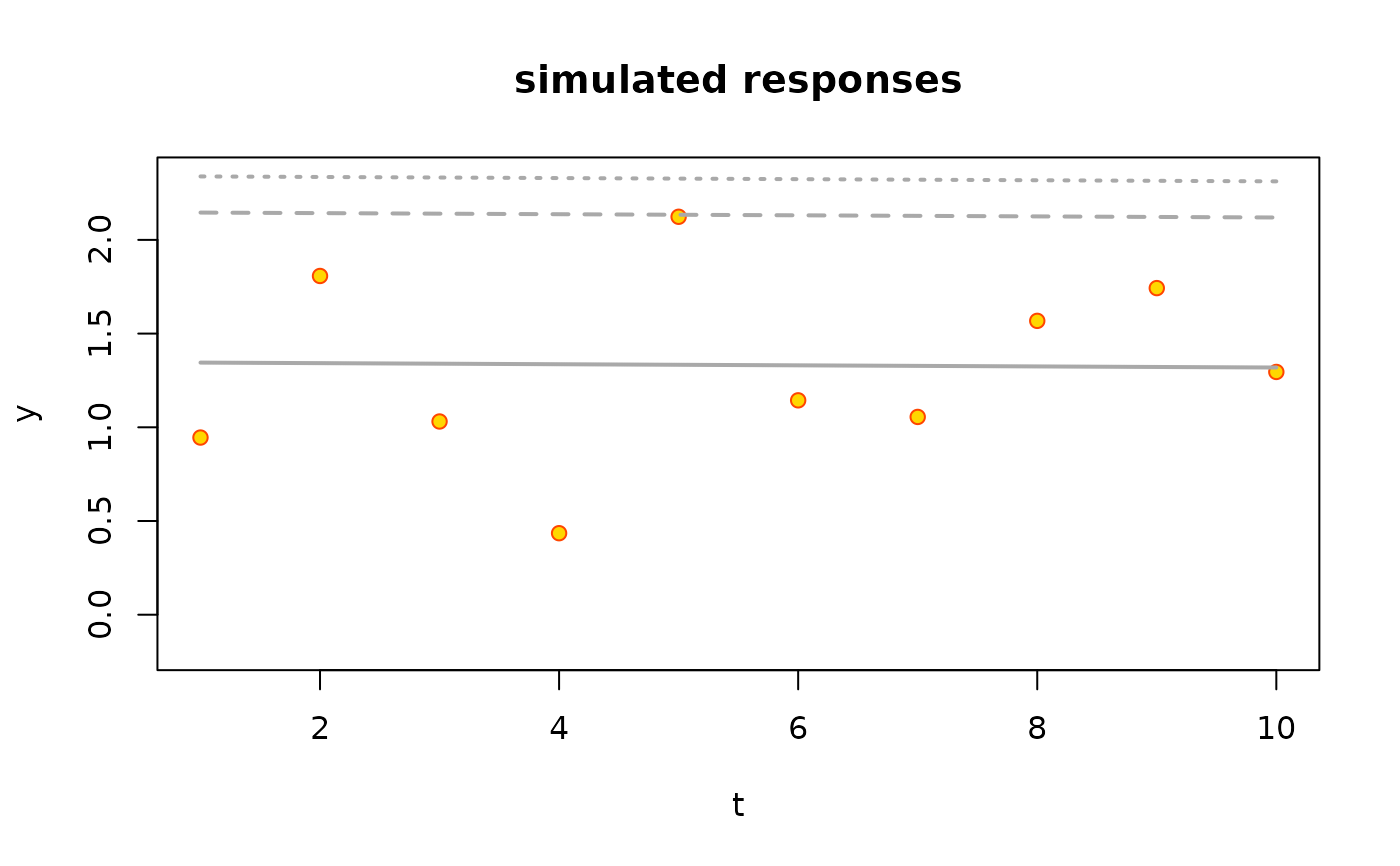
plot(ns1, which = 1)
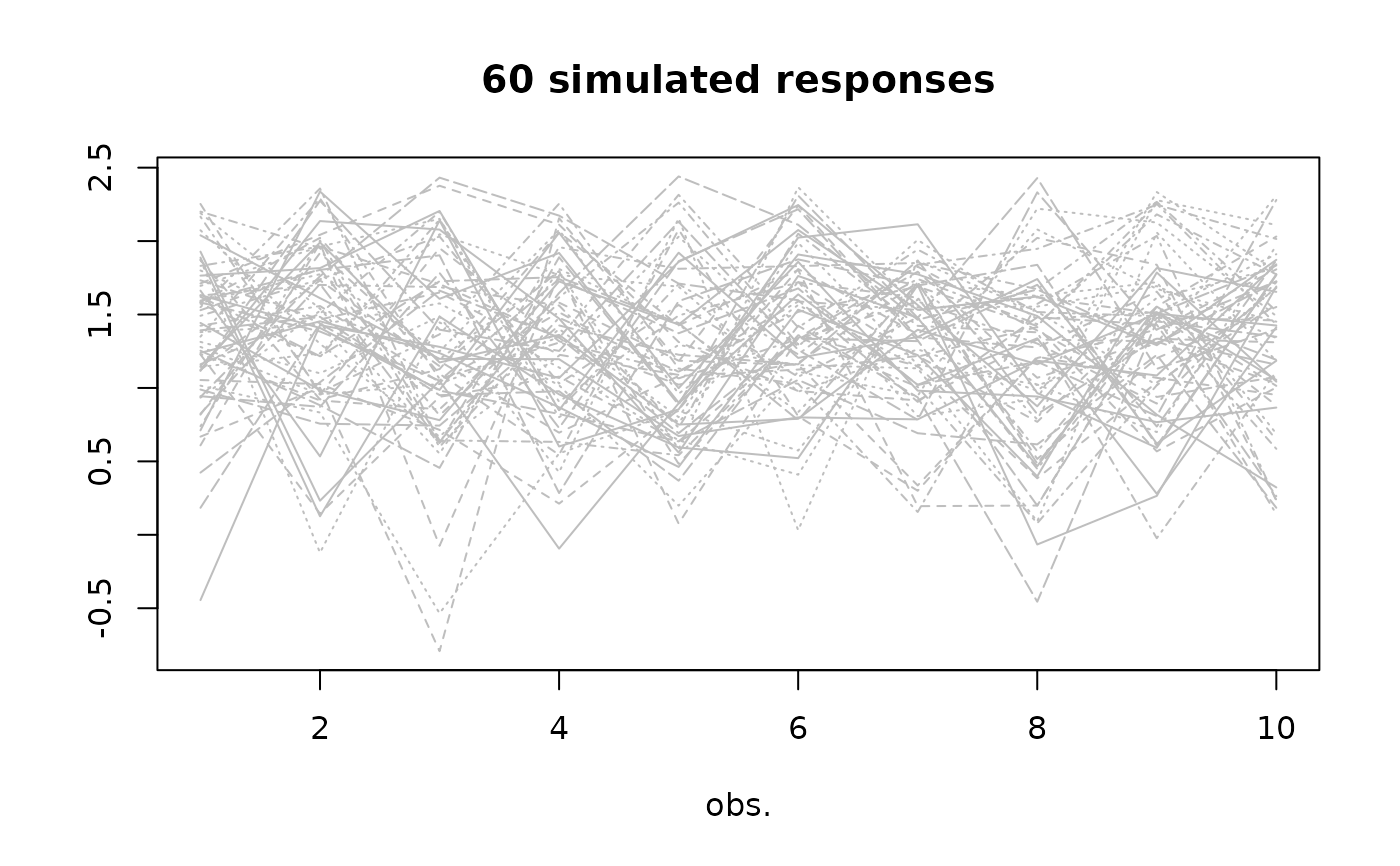 plot(ns1, which = 2)