Draw a ggplot layer for a potData object.
Arguments
- object
A
potDataobject.- type
See
autoplot.potData.- aes
Logical. If
TRUEthe colour, fill and shape of the points are used within the aesthetic functionaeswo they are registred to appear in legends.- xVar
See
autoplot.potData.- group
See
autoplot.potData.- points, a
See
autoplot.potData. '"p". SeeRP.potData.- ...
Other arguments passed to
geom_point.
Note
With aes = TRUE it can be needed to reset the scales
to avoid the creation of confusing legends. The package
ggnewscale can be of some help then.
Examples
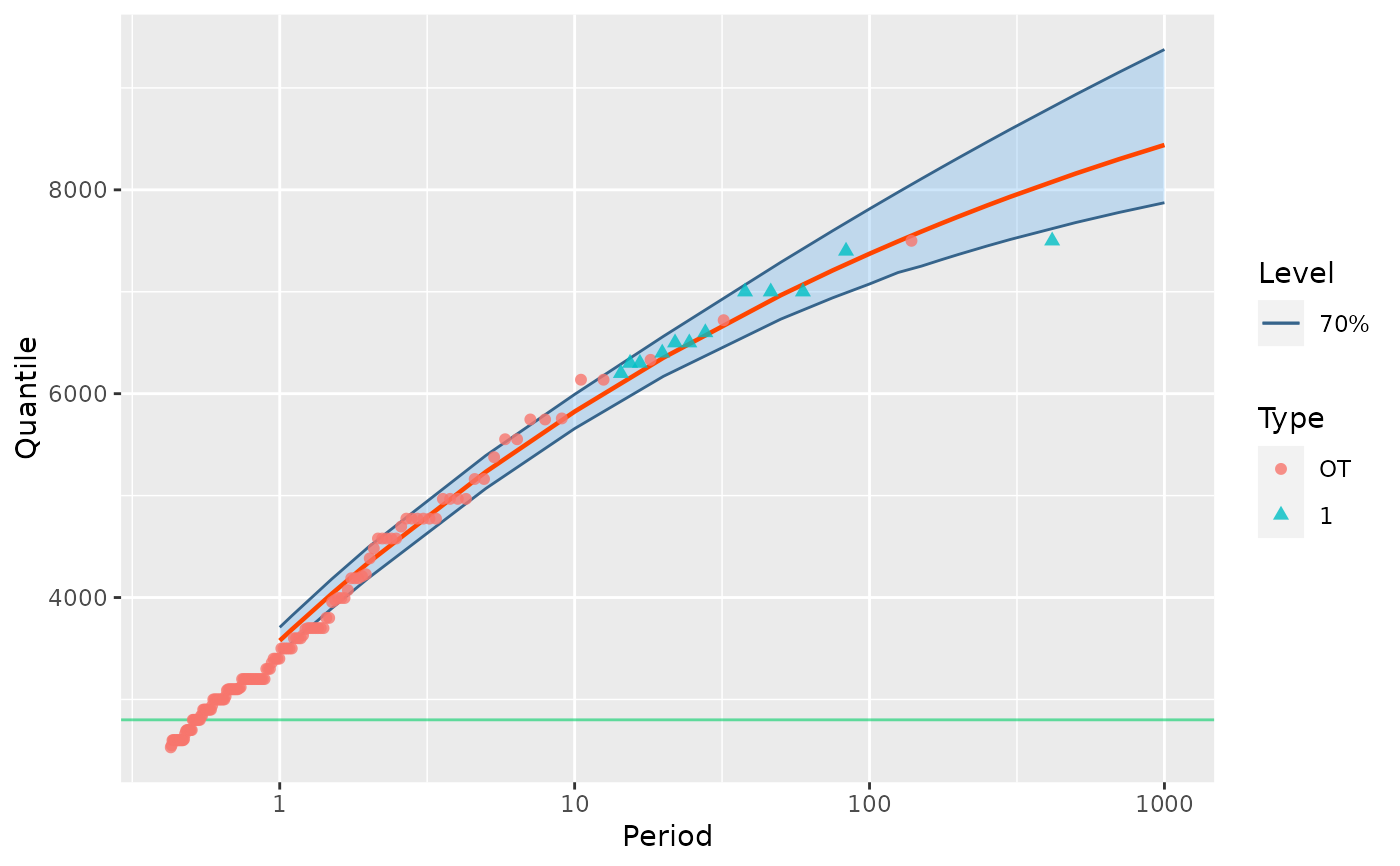
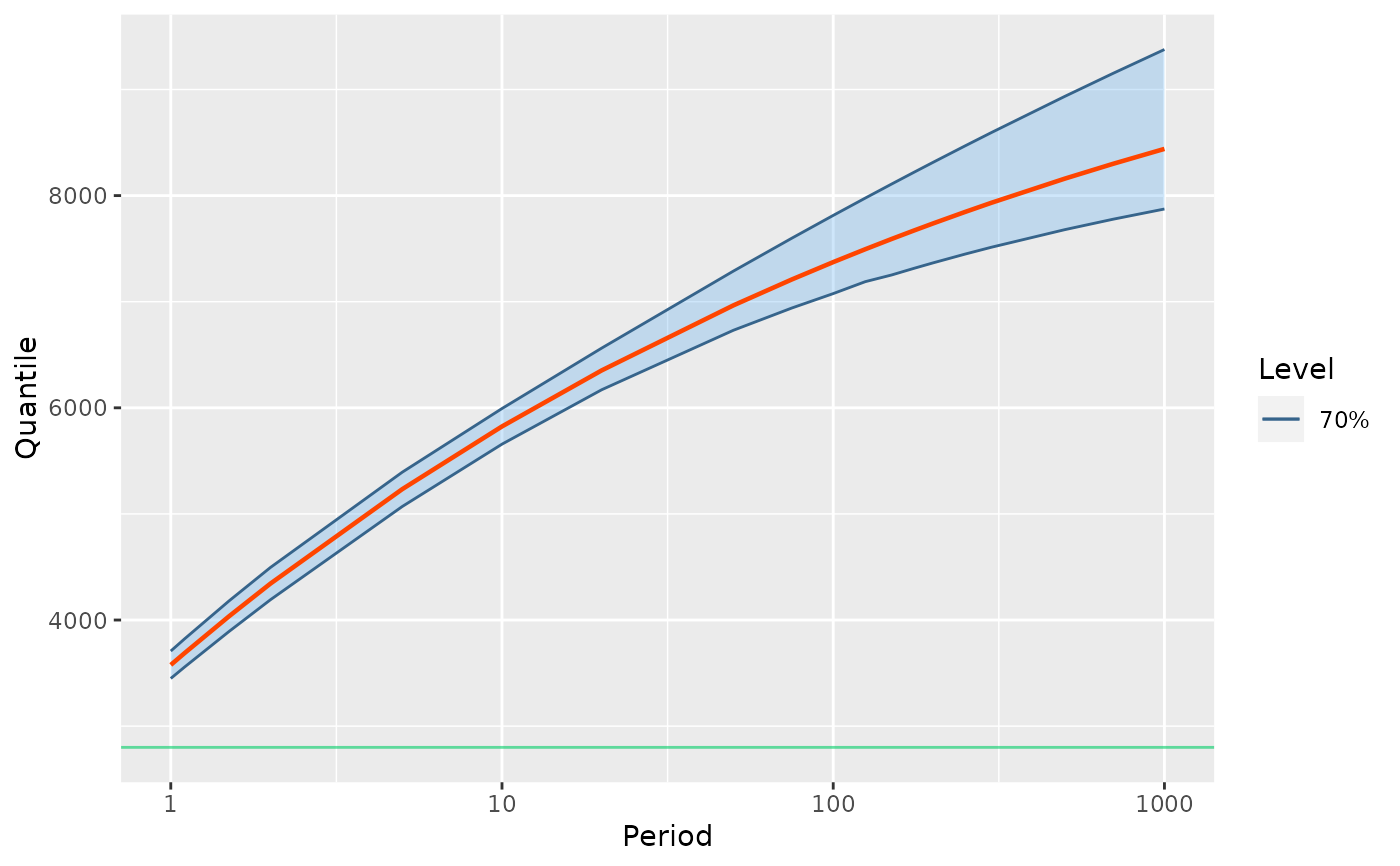
fit <- poisGP(data = Garonne, threshold = 2800)
RL <- RL(fit)
g <- autoplot(RL)
g

pdat <- as.potData(Garonne)
g1 <- g + autolayer(pdat, aes = TRUE)
g1
pdat <- as.potData(Garonne)
g1 <- g + autolayer(pdat, aes = TRUE)
g1