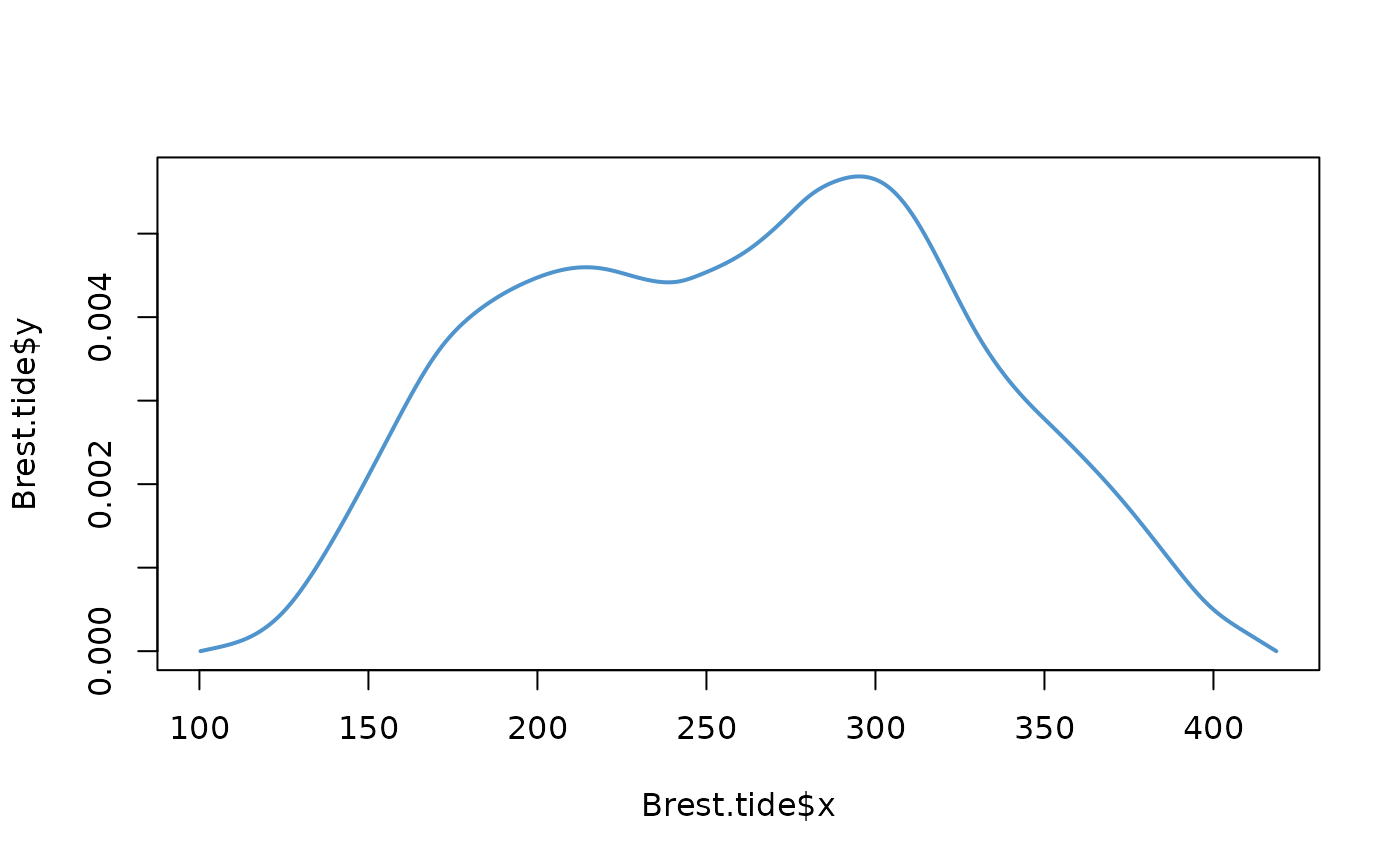
Density for the tidal level at Brest
Brest.tide.RdGridded density for the tidal part of the sea level at Brest.
Usage
data(Brest.tide)Format
The format is: List of 2
$x num [1:512]
100 101 102 102 103...$y num [1:512]
0.00 5.84e-06 1.12e-05 1.66e-05 2.20e-05...
Details
This dataset gives an example of structure for further tidal
densities. A desirable feature is that the values of y at end
points should be zero (or numerically such) so that the first and last
values of x indicate the Lowest possible value (Lowest
Astronomical High Tide) and the Highest Astronomical Tide (HAT).
The length of the vectors could have the form \(2^p+1\) with
\(p\) integer for speed considerations in convolution. However in
the present package the vector y will usually be interpolated
to a longer one and an optimized choice of length will have no effect.