Classical "exponential distribution" plot
expplot.RdPlot a vector using "exponential distribution" scales
Arguments
- x
-
The vector to be plotted.
- plot.pos
-
Plotting position for points: either "exp" for expected ranks or "med" for a median rank approximation (see Details below).
- rate
-
Rate parameter for one or several "exponential distribution" lines to be plotted
- labels
Text to display in legend when "exponential distribution" lines are specified
- mono
-
Monochrome graph?
- ...
-
Arguments to be passed to
plot.
Details
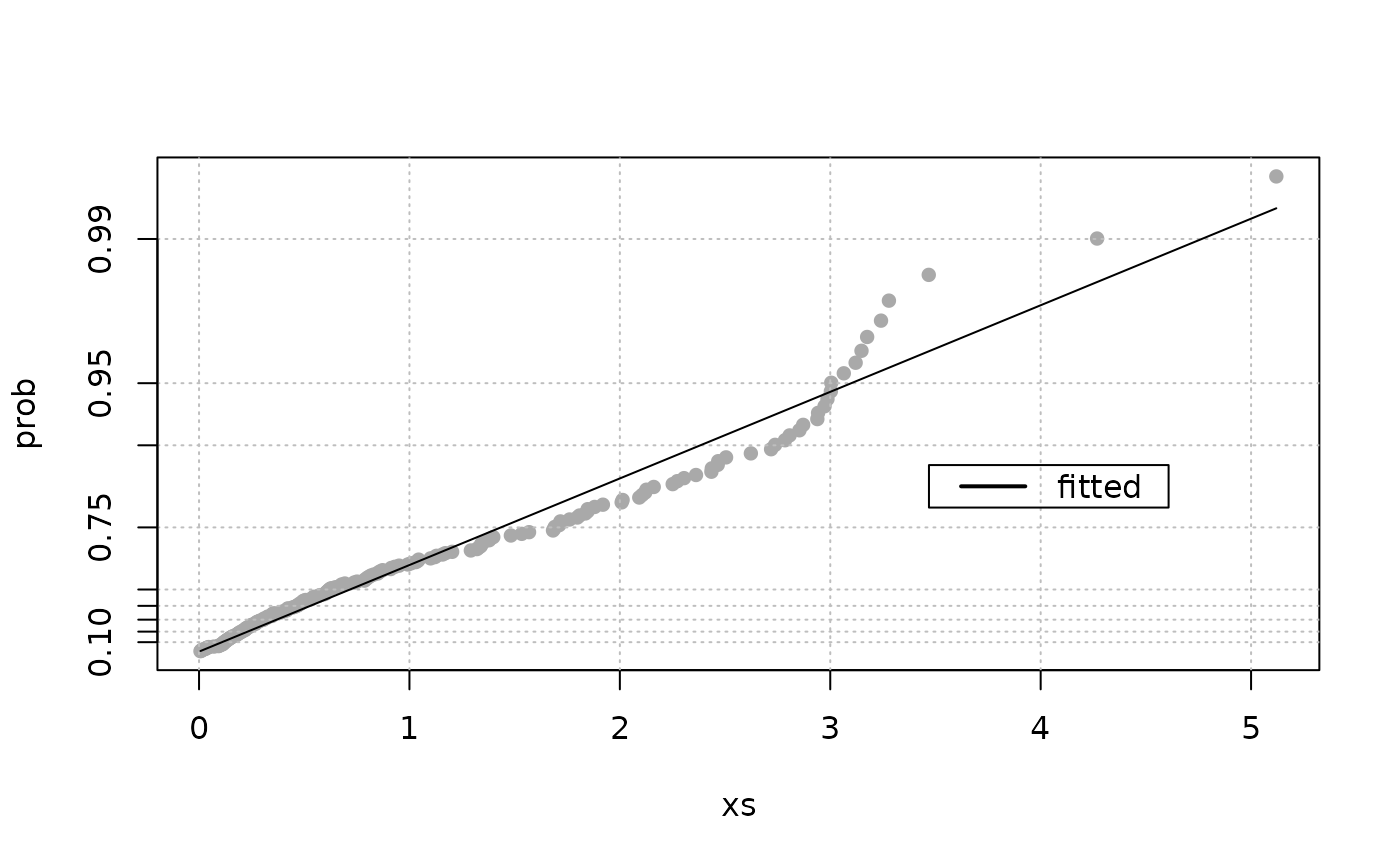
This plot shows \(-\log[1-F(x)]\) against \(x\)
where \(F(x)\) at point \(i\) is taken as
\(i/(n+1)\) if plot.pos is "exp", or as the
"median rank" approximation \((i-0.3)/(n+0.4)\) if
plot.pos is "med".
If the data in x is a sample from an exponential distribution,
the points should be roughly aligned. However the largest order
statistics have high sampling dispersion.
Note
The log scale for y is emulated via the construction of suitable
graduations. So be careful when adding graphical material (points,
etc) to this graph with functions of the "add to plot" family
(points, lines, ...).
The ML estimate of the rate parameter is the inverse of the
sample mean.